
Building a data lake on your laptop to get hands-on experience with big data technologies. With PySpark and Delta Lake, you can create a scalable, reliable data storage solution right on your local machine. This guide will walk you through the process, step-by-step, including setting up a virtual environment, installing the necessary tools, and loading and querying data.
Step 1: Setting Up Your Python Virtual Environment
Before diving into PySpark and Delta Lake, it’s a good practice to create a Python virtual environment. This isolates your project dependencies, ensuring they don’t interfere with other projects.
Step 1: Create a Virtual Environment Navigate to your project directory and create a virtual environment:
python -m venv datalake_envStep 2: Activate the Virtual Environment
- On macOS/Linux:
source datalake_env/bin/activate
- On Windows:
datalake_env\Scripts\activate
Step 2: Install Required Packages
With your virtual environment activated, install PySpark and Delta Lake:
pip install --upgrade pyspark          # Upgrade PySpark to the latest version
pip install delta-spark==3.2            # Install a compatible Delta Lake version
pip install jupyter                              # Notebook to run the code
pip install geopandas
# start jupyter notebook
jupyter notebook
Step 3: Set Up PySpark with Delta Lake
Now that you’ve set up your environment, you’ll need to configure Spark to work with Delta Lake.
- In your Python script or Jupyter Notebook, configure Spark to use Delta Lake:
import pyspark
from delta import *

builder = pyspark.sql.SparkSession.builder.appName("MyApp") \
    .config("spark.sql.extensions", "io.delta.sql.DeltaSparkSessionExtension") \
    .config("spark.sql.catalog.spark_catalog", "org.apache.spark.sql.delta.catalog.DeltaCatalog")

spark = configure_spark_with_delta_pip(builder).getOrCreate()
Step 4: Download and Prepare New York City Taxi Data
- Download Data: Obtain the New York City taxi trip data(a perfect dataset for Data Lake use cases ) from NYC Taxi and Limousine Commission. For this guide, you might choose a sample file like
yellow_tripdata_2024-01.parquet. - Load Data into PySpark: Create a Python script or Jupyter Notebook and set up the Spark session:
! wget https://d37ci6vzurychx.cloudfront.net/trip-data/yellow_tripdata_2024-01.parquet .
df = spark.read.parquet("yellow_tripdata_2024-01.parquet")
df.show(5)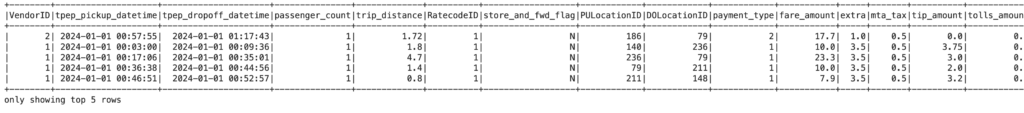
Step 5: Create and Manage Delta Tables in Data Lake
- Write and Read Data from Delta Table: Save the DataFrame as a Delta table for efficient querying and updates
df.write.format("delta").mode("overwrite").save("/content/nytaxi_delta_table")
delta_df = spark.read.format("delta").load("/content/nytaxi_delta_table")
delta_df.show(5)
Step 6: Transforming Data Using PySpark
Now let’s perform some data transformations to clean and prepare the data for analysis.
Pre-Transformation View
- Filter trips with distance greater than 1 mile and passenger count less than 5.
- Add a new column calculating trip duration in minutes
filtered_df = delta_df.filter((delta_df.trip_distance > 1) & (delta_df.passenger_count < 5))


from pyspark.sql.functions import col, unix_timestamp, round

transformed_df = filtered_df.withColumn(
    "trip_duration",
    round((unix_timestamp(col("tpep_dropoff_datetime")) - unix_timestamp(col("tpep_pickup_datetime"))) / 60, 2)
)
transformed_df.show(5)
3. Group by VendorID and calculate the average trip duration:
avg_duration_df = transformed_df.groupBy("VendorID").avg("trip_duration")
avg_duration_df.show()

+--------+------------------+
|VendorID|avg(trip_duration)|
+--------+------------------+
|       1|19.204002108542397|
|       2|18.543873848867833|
+--------+------------------+
4. Identify peak times by hour:
from pyspark.sql.functions import hour

peak_times_df = transformed_df.groupBy(hour("tpep_pickup_datetime").alias("hour")).count().orderBy("hour")
peak_times_df.show()

+----+------+
|hour| count|
+----+------+
|   0| 56024|
|   1| 35794|
|   2| 25240|
|   3| 16282|
|   4| 10612|
|   5| 12931|
|   6| 28417|
|   7| 57112|
|   8| 77286|
|   9| 86733|
|  10| 94516|
|  11|100894|
|  12|109917|
|  13|114464|
|  14|124946|
|  15|129590|
|  16|131931|
|  17|140441|
|  18|143232|
|  19|127176|
+----+------+
only showing top 20 rows
Step 6: Geo Spacial Analysis
Download data from TLC Trip Record Data website and join it with the trip Dataframe. Details steps explained at: Databricks website
import geopandas as gpd
file_url = "https://d37ci6vzurychx.cloudfront.net/misc/taxi_zones.zip"
gdf = gpd.read_file(file_url)
gdf.head()
import pandas as pd

# this function returns a spak dataframe with x and y points from the provided GeoDataFrame
def get_location_cords(gdf):
  gdf['lon'] = gdf.geometry.centroid.x
  gdf['lat'] = gdf.geometry.centroid.y
  sdf = spark.createDataFrame(pd.DataFrame(gdf).drop(['geometry'], axis=1))
  return sdf

sdf = get_location_cords(gdf)
sdf.show()
Next, join both the DataFrames and to create new DataFrame with Pickup location and location coordinates:
from pyspark.sql.functions import monotonically_increasing_id
geo_df = transformed_df.join(sdf, transformed_df.PULocationID == sdf.LocationID, "left").select(transformed_df["PULocationID"], sdf["lon"], sdf["lat"]).withColumn("index_column",monotonically_increasing_id())
geo_df.show(5)

Next, will get the Geometry Points using below function:
def spark_df_to_geopandas_df_for_points(sdf):
  df = sdf.toPandas()
  gdf = gpd.GeoDataFrame(
    df.drop(['lon', 'lat'], axis=1),
    crs={'init': 'epsg:4326'},
    geometry=[Point(xy) for xy in zip(df.lon, df.lat)])
  return gdf
Finally, aggregate the location count and plot the data and no surprise the brightest point in JFK airport for highest number of trips:
geo_count_df=geo_df.groupBy('PULocationID','lat','lon').count()
result_gdf = spark_df_to_geopandas_df_for_points(geo_count_df)

plt = gdf.plot(column='LocationID', cmap='Greys', figsize=(9,5))
plt = result_gdf.plot(ax=plt, column='count',cmap='OrRd', legend=True,aspect=1,legend_kwds={"label": "NYC Taxi Number of Trips", "orientation": "horizontal"},)
display(plt)
This article provides a practical step by step approach to build and manage a data lake using PySpark and Delta Lake with real-world New York City taxi data. It covers setting up the environment, installing tools, transforming the dataset, and performing queries and analysis using GeoSpacial plot. For comparing data lake with other architectures(data warehouse and data lakehouse) read how they compare in our [2025 data platform comparison].
1 thought on “Setting Up a Data Lake for GeoSpacial Analysis”